 Docs
Blog
Source
Wiki
Bugs
An open source AIR application for intense ActionScript 3 debugging.
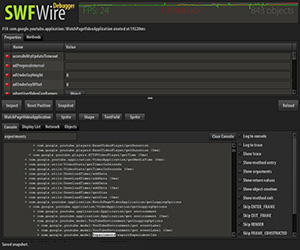
 Console tab with Show method entry selected allows you to see a full trace of function calls.
Calls from the fl. and mx. packages are hidden to reduce noise.
A search box lets you quickly find the call you're looking for.
 The Properties tab lets you view and modify all properties of an object.
Even private, protected, and dynamic properties are editable.
Dictionary keys show up as buttons, so you can inspect them too.
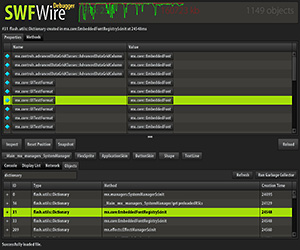
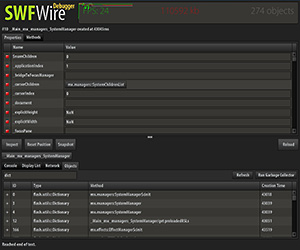
 The Objects tab provides a list of all objects in the SWF.
The Quick Diff column shows which objects have been added or removed since the last refresh.
The Method and Creation Time columns show where and when the object was created.
A filter box lets you quickly find the objects you're looking for based on object type.
 The Inspect button allows you to quickly choose a DisplayObject for inspection.
Clicking on your SWF in inspect mode will show a list of all leaf nodes hit.